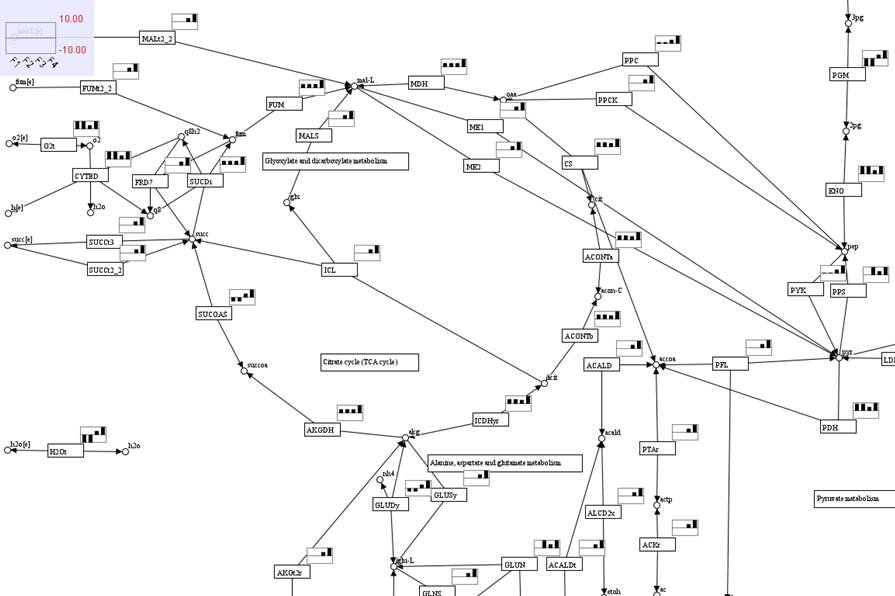
Flux visualization
As mentioned early in Simulation, reaction fluxes can
be loaded into a map for visualization. GEMSiRV
provides a function in loading reaction fluxes by right clicking on a map to Load
reaction fluxes.
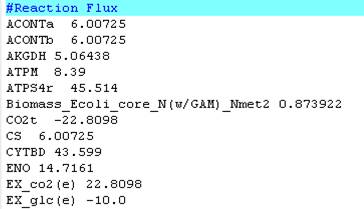
A single run
of simulation: (A header line beginning with “#” is optional)
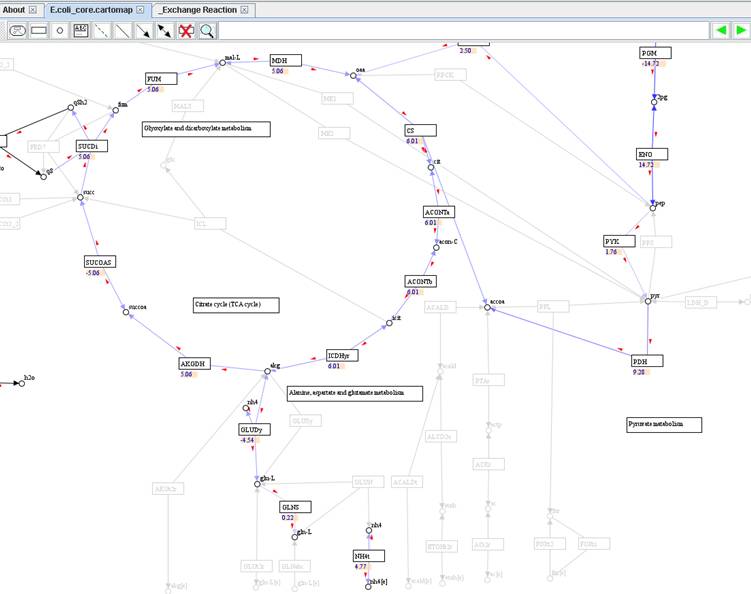
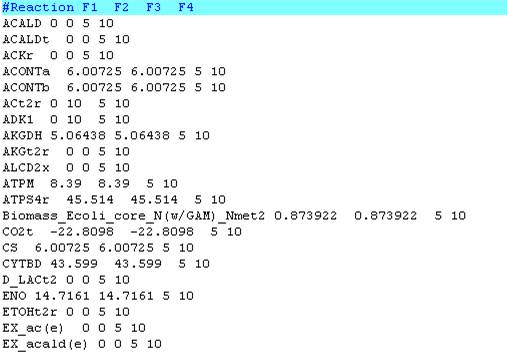
Multiple runs
of simulation: (A header line beginning with “#” is preferred for labeling in
legend)
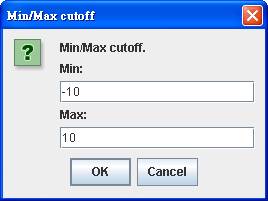
A visual flux
range can be set: