Gene expression visualization
Because GEMSiRV allows users to extract information
from a model to a map, in addition to reaction fluxes, gene expressions can
also be loaded into a map for visualization. In this circumstance, we can
simultaneously compare the differences of reaction fluxes with that of gene
expressions in two conditions (e.g. aerobic and anaerobic conditions).
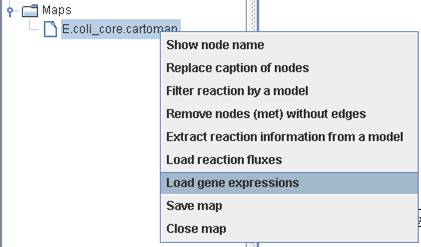
Right click
on a map to Load gene expressions.
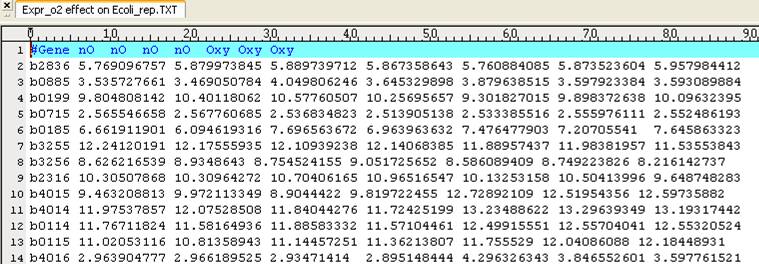
You can use
identical header to represent the replicates of condition. Then the mean and
standard deviation of gene expression for a specific gene will be shown in the
map. Here, we used the expression data (array number 42-48) available in http://systemsbiology.ucsd.edu/In_Silico_Organisms/E_coli/E_coli_expression2.
Because we
want to visualize reaction fluxes and gene expressions on a map, we firstly load
the reaction fluxes which were simulated by setting the LB and UB of EX_o2(e)
to close and open bound for anaerobic and aerobic conditions (nO and Oxy),
respectively. The right upper panel of reaction shows the reaction fluxes for the
two conditions.
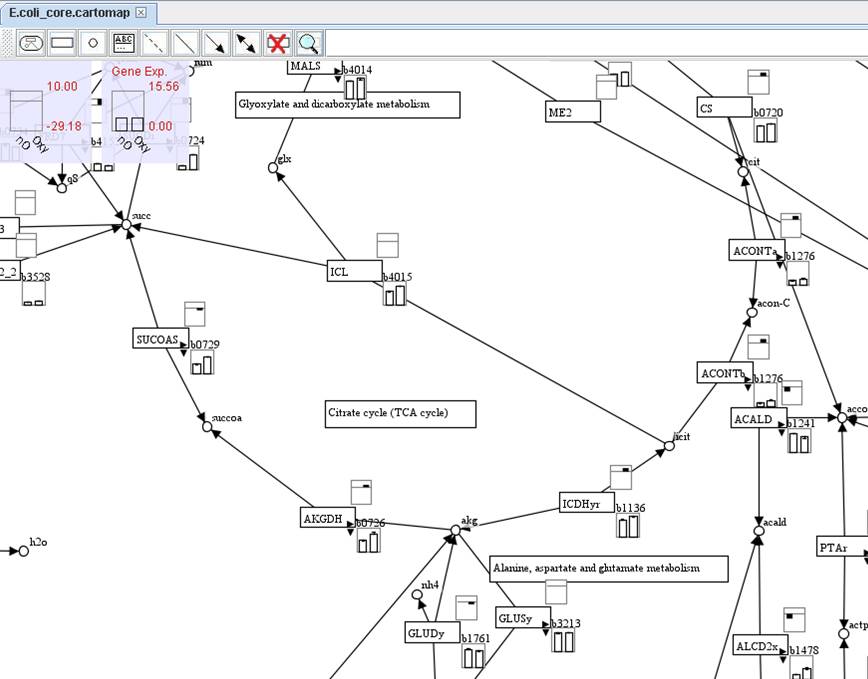
The right
lower panel of reaction shows the expressions of associated genes. In default,
the gene with the largest expression among the associated genes will be
present. You can click on the small right arrow to present other gene
expressions of associated genes or you can click on the small down arrow to
show all gene expressions of associated genes.
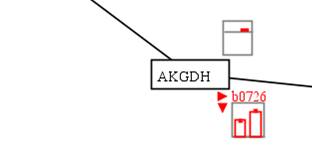
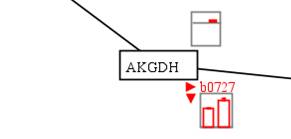
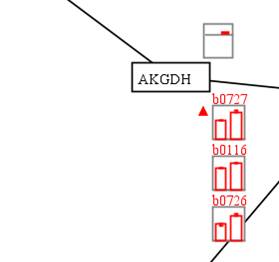
In this
example, we can see that the AKGDH reaction-associated genes b0116, b0726 and
b0727 were up-regulated in aerobic condition and the corresponding reaction
flux was increased.